Nex̱wlélex̱wm/Bowen Island Biodiversity Plan
At a glance
The first systematic, island-wide biodiversity plan for Bowen Island. Produced for the Bowen Island Conservancy in collaboration with Simon Fraser University, timed to feed into a revision of the island’s Official Community Plan.
- My role: GIS Technician and co-author at SFU. Responsible for all spatial analysis, conservation prioritization, mapping, and the public web application.
- Scale: Species distribution models for 195 vertebrate species, 33 habitat types, and an ecological intactness layer, integrated using the Zonation conservation prioritization algorithm.
- Central output: A Conservation Values map ranking every 100m × 100m pixel on the island by biodiversity importance. Overlap analysis of conservation values with wildfire threats, land use types, and development potential.
- Key finding: Only 22% of the island’s highest-value conservation areas are currently protected. 42% fall on private land. 26% are highly vulnerable to wildfire.
- Deliverables: Planning maps, candidate protected areas and corridors, and an interactive public web application.
- Reach: Presented to Bowen Island Municipal Council and the OCP Committee. Open house drew 100+ attendees. Maps incorporated into the Official Community Plan, formalizing biodiversity values into policy. 200+ visits to the interactive web application.
Context
Bowen Island, Nexwlélexwm in the Squamish Nation language, sits at the centre of Canada’s newest UNESCO Biosphere Region. Its terrestrial habitats span a broad range of northwest coast ecosystems: mature forests, coastal bluffs, lakes, wetlands, and estuarine environments. Citizens have consistently ranked environmental protection as their top community value. Before this project though, Bowen Island had no whole-island systematic, science-based picture of where that biodiversity actually concentrates or what most threatens it.
Ecological data did exist before this project: past environmental assessments, citizen science records (eBird, iNaturalist), species distribution models, and local naturalist knowledge. This information was scattered and difficult to act on though, especially for a small municipality with limited technical resources. The Bowen Island Biodiversity Plan was the first effort to draw these disparate sources together into a single, planning-ready resource, timed for the next revision of the island’s Official Community Plan.
My Role
I contributed to this project as GIS Technician and co-author at Simon Fraser University, working under the direction of Dr. Wendy Palen (Biological Sciences, SFU) and Dr. Thomas Sisk (Adjunct, SFU). This project was made possible with support from the Bowen Island Conservancy, the Sitka Foundation, NSERC, and SFU.
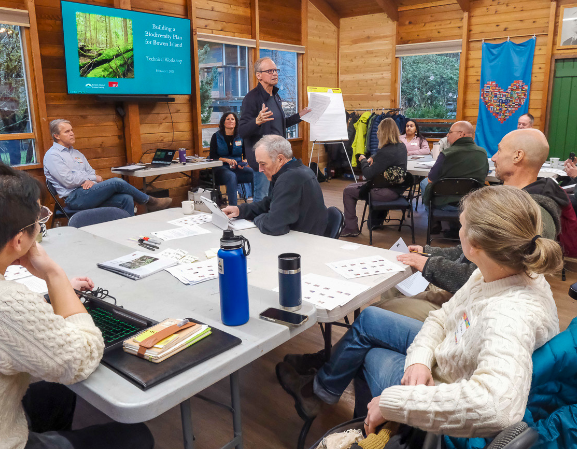
My scope was the spatial data and technical side of the plan: processing species distribution models, compiling and harmonizing habitat datasets, running the conservation prioritization analysis, producing all the maps, and building the public-facing web application. The scientific framing and planning recommendations were a collaborative effort across the team. I was one of the facilitators for the technical workshop, working with local experts at the early stages to inform the development of the Bowen Island Biodiversity Plan.
Approach
No systematic, island-wide biodiversity inventory existed for Bowen Island, so the analysis had to be model-based. The core insight was that biodiversity value has two distinct components: where species and habitats are found, and how intact those places still are. Combining both is what makes conservation prioritization meaningful.
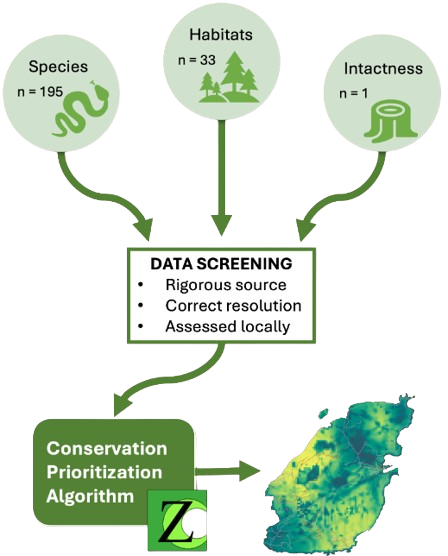
Biodiversity layers: We drew on Species Distribution Models (SDMs) developed at the Palen Lab to estimate the likely distribution of 195 vertebrate species across the island at 100m × 100m resolution. Citizen science occurrence data (eBird, iNaturalist) plus locally counted heron and raptor nests fed these models. For habitats, we compiled 33 types from three sources: Metro Vancouver’s Sensitive Ecosystem Inventory (2021), the Islands Trust’s Terrestrial Ecosystem Mapping (2019), and Alan Whitehead’s locally-mapped freshwater habitat database (2025). Freshwater habitats warranted their own layer. The SDM approach doesn’t work well for aquatic species, as the data don’t exist at the same scale.
Intactness: We used the inverse of the Human Footprint database (Oscar Venter, UNBC), a composite of 12 indicators of human land transformation, to measure ecological intactness across the island. This distinguishes places where biodiversity is intact from places that may still have high species richness but have been degraded by human activity and may need active restoration.
Conservation prioritization: All three data streams (195 species layers + 33 habitat layers + 1 intactness layer) were fed into Zonation, a conservation prioritization algorithm developed at the University of Helsinki. Zonation ranks every pixel on the island by its overall conservation value, accounting for rarity, richness, and intactness. The resulting Conservation Values map is the central output and the foundation for every subsequent analysis.
Threats analysis: Alongside the biodiversity and intactness work, we produced two standalone threat maps, both fed directly into the overlay analyses. The wildfire vulnerability index combines aspect, slope, and ecosystem type to estimate where biodiversity is most susceptible to the negative effects of fire. This is distinct from the WUI (Wildland-Urban Interface) map used for human safety planning, and is intended specifically to inform conservation and fuel management decisions. Aspect and slope were derived from raw LiDAR point cloud data, as these layers didn’t exist at the correct resolution for our analysis. The development pressure map estimates subdivision capacity per private parcel under current zoning, showing where future residential development could overlap with high-value biodiversity areas.
Overlay analyses: We then overlaid the top 30% of conservation values against five planning-relevant layers: ecological intactness, private land ownership, existing protected areas, wildfire vulnerability, and development pressure. Each overlay answers a different planning question: where can we protect vs. restore? Who owns the land? What is already protected? Where does fire risk or future development intersect biodiversity hotspots?
Candidate protected areas and corridors: These are two distinct outputs derived differently. The candidate protected areas were identified through a prioritization algorithm that took the Zonation conservation value output and weighted it against spatial contiguity, favouring Crown Land parcels that are both high value and part of larger contiguous blocks. Connected habitat is more defensible and ecologically functional than scattered patches. The candidate corridors, by contrast, were drawn from expert opinion within the co-author group. These are routes that the team judged likely to support wildlife movement between core areas. Both are framed explicitly as possible options to illustrate what a strengthened conservation network could look like, not as specific recommendations.
Deliverables
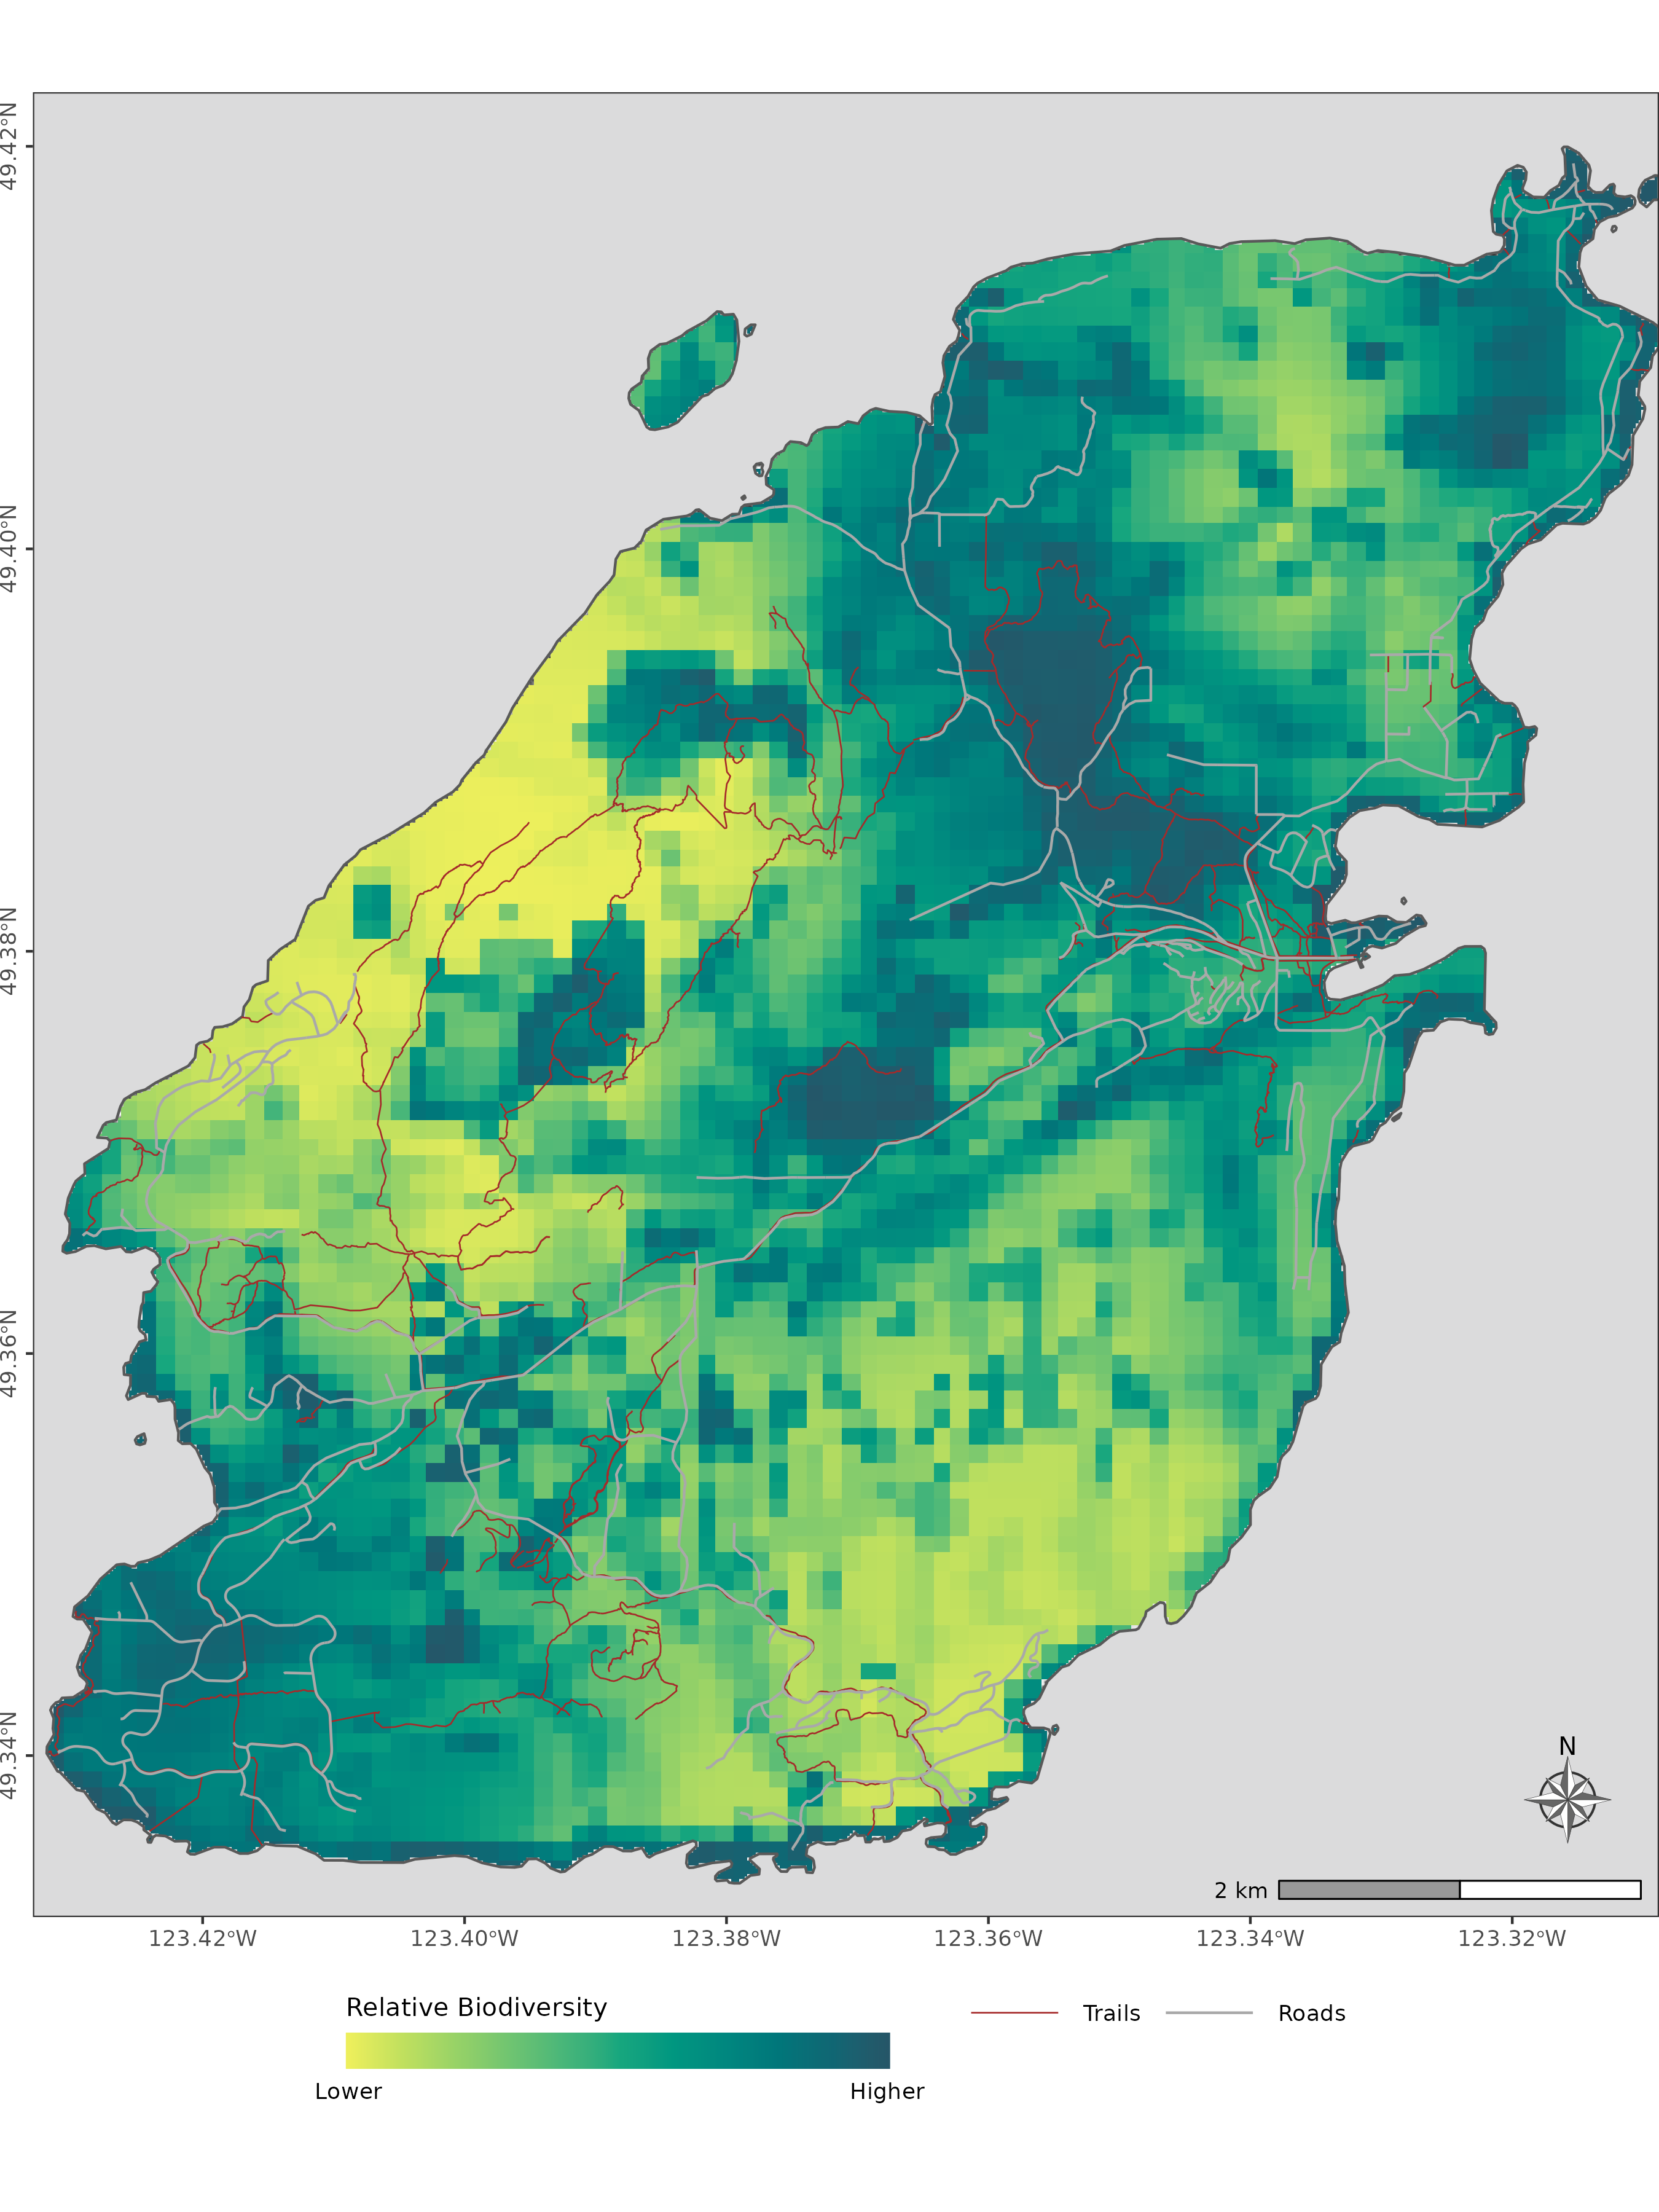
Biodiversity and conservation values maps: a suite of island-wide maps produced at 100m resolution, including vertebrate species richness (first shore-to-shore map of its kind for Bowen), overall habitat richness (33 types), freshwater habitat richness, ecological intactness, and the integrated Conservation Values map combining all three. Additional maps show the top 30% conservation values and five overlay analyses (conservation values × intactness, private lands, existing protected areas, wildfire vulnerability, and development pressure).
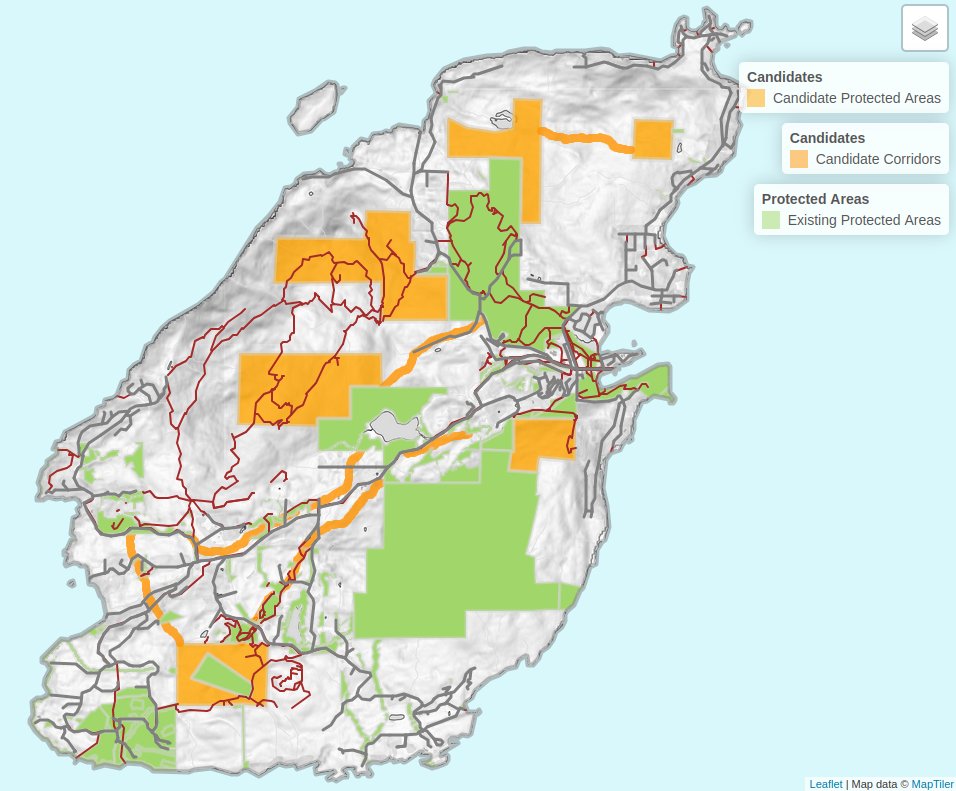
Candidate protected areas and corridors: a provisional map showing two distinct layers. Candidate Crown Land parcels were identified through a prioritization algorithm weighting conservation value against contiguity. Potential corridor zones were drawn from expert opinion within the co-author group. Together they illustrate one possible configuration of a strengthened conservation network capable of approaching Canada’s ‘30 by 30’ protection target for the island, framed as options to prompt planning discussion, not as specific recommendations.
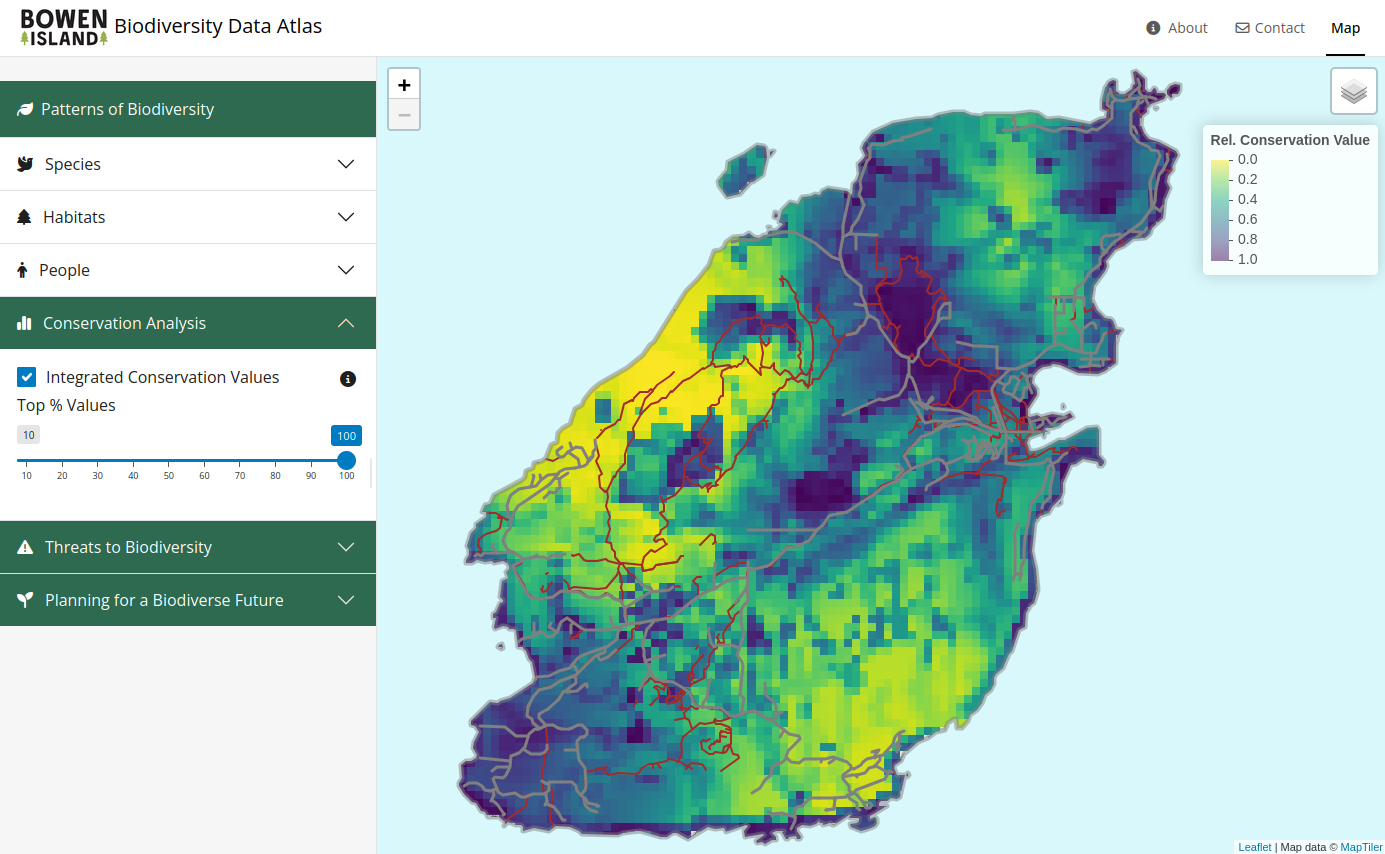
Interactive web application: a public-facing digital data atlas that makes all the maps and data layers accessible to residents, planners, and the community without needing GIS software. Users can explore biodiversity patterns, overlay planning layers, and investigate different conservation scenarios. Built in R Shiny, hosted on Posit Connect. (See the Web Application Live Here)
Impact
The plan was presented to Bowen Island Municipal Council, the Municipal Planning Office, the Official Community Plan (OCP) Committee, and leaders of the Howe Sound Biosphere Region Initiative Society. The community engagement process included an open house (100+ attendees), a technical workshop (40+ participants), and school events.
The three overarching planning recommendations call for: (1) incorporating the Conservation Values map into the forthcoming Official Community Plan as a scheduled map, formalizing Bowen’s commitment to biodiversity in municipal policy; (2) advocating for new protected areas on Crown Lands to strengthen the conservation network; and (3) protecting and enhancing habitat corridors that link the island’s core areas.
As of the May 5th, 2026 draft of the Official Community Plan for Bowen Island, the Conservation Values map has been included, with policies stating that rezoning applications should be discouraged in areas of high biodiversity.
A key finding with direct policy implications: only 22% of the island’s highest-value conservation areas currently fall within protected areas, 42% occur on private land, and 26% are highly vulnerable to wildfire. This makes a purely protected-area strategy insufficient. The plan provides the evidence base for a mixed strategy involving landowner engagement, zoning changes, and coordinated stewardship.
The web application was designed as a living resource, making the data accessible so that residents, planners, and community organizations can continue using it as planning processes evolve, not just during the plan’s release. Since launching in mid-March, it has attracted around 200 visitors with an average engagement time of over three minutes, suggesting that visitors are genuinely interacting with the maps rather than bouncing immediately.
Reflection
One of the most fulfilling parts of this project was being part of a process that actually put existing ecological data to work. There is a common thread in conservation science about the need to study and document nature, and that is true. But unless that data makes its way into real decisions, we miss much of its value. Bringing the science closer to the people making planning decisions felt genuinely meaningful, because it makes it more likely that biodiversity will be a real part of how Bowen Island shapes its future.
The project was initially scoped as a few months of work and ended up taking well over a year. There was a lot of scope creep, stemming from fairly vague objectives and outputs at the beginning of the project. I take some responsibility for that, as the work kept revealing new questions and possibilities. From my experience on the Bowen Island Biodiversity Plan, I can carry forward the ability to scope complex projects more precisely from the start and keep a clearer line of sight to the end deliverables.
Communicating the process to different audiences turned out to be its own skill. I often overcommunicated technical details that were not relevant to audiences who simply wanted the outputs rather than the steps along the way. Learning to read the room and adjust what I share, and how I share it, is something I am still developing.
I also overengineered the web application significantly in the early stages, building features that were too complicated to maintain or explain to a general user. I actually removed features in the latter half of development. The simpler version is better, and it is a lesson I will carry into any future tool-building work.
What I am most proud of is the completeness of what we delivered. Starting from a scattered, unstructured mix of data sources with no roadmap for how to use them, we produced something as concrete as “here is where new protected areas would have the most impact” and made it accessible through an interactive web application with novel data visualization. That is the kind of work I find most satisfying.
Skills demonstrated
- Species Distribution Modelling (SDM)
- Conservation prioritization (Zonation algorithm)
- Spatial data analysis and GIS
- LiDAR
- Habitat mapping and ecosystem classification
- UX / UI for interactive spatial data dashboards
- R / R Shiny web application development
- Science communication (translating complex analyses for public and planning audiences)
- Conservation planning
- Wildfire vulnerability analysis
- Multi-source data integration and harmonization
Links
News Article: What the Bowen Island Biodiversity Plan gives us
Bowen Island Conservancy: Bowen Island Biodiversity Plan
GitHub Repo
Web Application
Interested in working together?
I’m always glad to talk about conservation, technology, and community work — collaborations, contributions, or just trading ideas.